


The Case for Natural Resource Equities
September 23, 2016
By Frank Holmes
CEO and Chief Investment Officer
U.S. Global Investors

This week I attended the Denver Gold Forum along with three other U.S. Global Investors representatives, including our resident precious metals expert Ralph Aldis. I was happy to see sentiment for gold way up compared to last year’s convention, as was turnout. I was also pleased to see Franco-Nevada, Silver Wheaton and Royal Gold in attendance, all of which I’ve written extensively about.
One of the most interesting presentations was held by Northern Star Resources—the third biggest listed gold producer in Australia, a dividend payer and a longtime holding of USGI. I’ve always appreciated Northern Star’s insistence on being a business first, a mining company second. This shareholder-friendly mantra is reflected in its stellar performance.
Compared to other companies in the NYSE ARCA Gold Miners Index (GDM), Northern Star is a sector leader in a number of factors, including five-year cash flow return on invested capital. Whereas the sector average is negative 1.6 percent over this period, Northern Star’s is a whopping 27 percent, the most of any other mining company in the GDM.
This has helped it return an amazing 800 percent over the last five years as of September 23. Compare that to the GDM, which returned negative 56 percent over the same period.
Australian gold miners as a whole trade at an impressive discount to North American producers, 5.7 times earnings versus 8.3 times earnings, according to Perth-based Doray Minerals.

Screening for high cash flow returns on invested capital, as you can see, helps give us a competitive advantage and uncovers hidden gems such as Northern Star and others.
Resource Equities Offer Attractive Diversification Benefits
A recent whitepaper published by investment strategist firm GMO makes a very convincing case for natural resource equities. I urge you to check out the entire piece when you have the time, but there are a few salient points I want to share with you here.
In the opinion of Lucas White and Jeremy Grantham, the paper’s authors, “prices of many commodities will rise in the decades to come due to growing demand and the finite supply of cheap resources,” presenting an attractive investment opportunity. Over the long-term, resource stocks have traded at a discount and outperformed their underlining metals and energy by a wide margin.
According to White and Grantham, a portfolio composed of 50 percent energy and metals, 50 percent all other equities, had a standard deviation that’s 35 percent lower than the S&P 500 Index. What’s more, the returns of such a portfolio outperformed those of the S&P 500, resulting in a risk-adjusted return that’s 50 percent higher than that of the broader market.

Resource equities have also historically shown a low to negative correlation to the broader market, which might appeal to bears. The reason? When metals and energy have risen in price, it’s been a drag on the economy. The reverse has also been true: Low prices have been a boon to the economy.
The thing is, general equities currently do not give investors enough exposure to natural resources. The weight of energy and metals in the S&P 500 has been halved in the last few years as oil and other materials have declined. Considering the diversification benefits, investors should consider a greater allocation to the sector.
Timing Is Key
There’s mounting evidence that now might be an opportune time to get back into resource stocks. Following the sharpest decline in crude oil prices in at least a century, as well as a six-year bear market in metals, the global environment could be ripe for a commodity rebound. From its January trough, the Bloomberg Commodity Index has rallied 17 percent, suggesting commodities might be seeking a path to a bull market.
During the down-cycle, many companies managed to bring costs lower, upgrade their asset portfolios and repair their balance sheets. As a result, many of them are now free cash flow positive and are in a much better positon to deliver on the bottom line when commodity prices increase.
I’ve often written about the imbalance between monetary and fiscal policies. My expectation is that unprecedented, expansionary global monetary policy will be followed by fiscal expansion. Consider this: Total assets of major central banks—including those in the U.S., European Union, Japan and China—have skyrocketed to $17.6 trillion dollars as of August 2016, up from $6.3 trillion in 2008.

This expansion is expected to result in significant inflation gains over the next decade, an environment in which natural resource stocks have historically outperformed the broader market.
Infrastructure Spending About to Increase?
China largely drove the global infrastructure build out over the past decade as rapid economic growth and rising incomes increased the demand for “advanced” and “quality of life” infrastructure. This resulted in a breathtaking commodities bull market.

Now, other advanced countries, the U.S. especially, are readying to sustain the next cycle to repair its aging and uncompetitive infrastructure.
As you can see, most major economies dramatically cut infrastructure spending after the financial crisis, indicating it might be time to put some of that $17.6 trillion to good use.

According to the Center on Budget and Policy Priorities (CBPP), the U.S. is presently facing a funding gap of $1.7 trillion on roads, bridges and transit alone—to say nothing of electricity, schools, airports and other needs. Meanwhile, state and local infrastructure spending is at a 30-year low.
If this financing can’t be raised, says the American Society of Civil Engineers (ASCE), each American household could lose an estimated $3,400 per year. Inefficient roadways and congested airports lead to longer travel times, and goods become more expensive to produce and transport.
Let’s look just at national bridges. After an assessment of bridges last year, the American Road & Transportation Builders Association (ARTBA) found that 58,495, or 10 percent of all bridges in the U.S., are“structurally deficient.” To bring all bridges up to satisfactory levels, the U.S. would currently need to spend more than $106 billion, which is six times what was spent nationwide on such projects in 2010.

Fortunately, both U.S. presidential candidates have pledged to boost infrastructure spending—one of the few things they share with one another. Hillary Clinton says she will spend $275 billion over a five-year period, while Donald Trump says he’ll spend “double” that.
Trump’s central campaign promise, as you know, is to build a “big, beautiful, powerful wall” along the U.S.-Mexico border, which analysts at investment firm Bernstein estimate could cost anywhere between$15 billion and $25 billion, requiring 7 million cubic metres of concrete and 2.4 million tonnes of cement, among other materials.
As I like to say, government policy is a precursor to change. I’ll be listening closely for further details on Trump and Clinton’s infrastructure plans this coming Monday during the candidates’ first debate. I hope you’ll watch it too! Media experts are already predicting Super Bowl-sized audiences.
Don’t Count China Out
In the past year, a lot of ink has been devoted to China’s slowdown after its phenomenal spending boom over the last decade, but there are signs that spending is perking up—a tailwind for resources. According to the Wall Street Journal, Chinese economic activity rebounded in August, driven by government spending on infrastructure and rising property taxes.
“In the first seven months of 2016,” the WSJ writes, “China invested 962.8 billion yuan ($144.1 billion) in roads and waterways, an 8.2 percent increase from the previous year.”
The Asian giant still accounts for a large percentage of global trade in important resources such as iron ore, aluminum, copper and coal. This is why we closely monitor the country’s purchasing manager’s index (PMI), which, according to our own research, has been a reliable indicator of commodity price performance three and six months out.
Let’s Do Lunch!
Next week I’ll be in Toronto speaking at Mines and Money, one of the world’s largest conferences on precious metals investing. It’s regularly attended by some of the most respected metals experts, analysts and investors. I hope to see you there!
What’s more, I’ll be hosting a special lunch with SmallCap Power on Tuesday, and you could win a seat at the table! If you’re interested in a chance at winning, just send me your investing question, and I’ll pick the best one. Good luck!

Index Summary
- The major market indices finished up this week. The Dow Jones Industrial Average gained 0.76 percent. The S&P 500 Stock Index rose 1.19 percent, while the Nasdaq Composite climbed 1.17 percent. The Russell 2000 small capitalization index gained 2.44 percent this week.
- The Hang Seng Composite gained 1.54 percent this week; while Taiwan was up 3.85 percent and the KOSPI rose 2.74 percent.
- The 10-year Treasury bond yield fell 7 basis points to 1.62 percent.
Domestic Equity Market

Strengths
- The best performing sector for the week was real estate, increasing by 4.25 percent versus an overall increase of 1.19 percent for the S&P 500.
- Health care company Endo International PLC was the best performing stock for the week, increasing 12.18 percent. Paul Campanelli who is the current President of generic and over-the-counter business was elected as the company’s new CEO. Analysts noted this move is consistent with corporate shifts toward generics. The stock was up on reaffirmed guidance.
- Microsoft announced a huge share-buyback program. The tech behemoth said it would buy back $40 billion worth of stock, or nearly 10 percent of shares outstanding, and raise its quarterly dividend by $0.03 a share to $0.39.
Weaknesses
- Energy was the worst performing sector for the week, still up 10 basis points. Oil sold off after Saudi Arabia was said to dismiss the prospects for a production-freeze agreement in Algiers.
- Chesapeake Energy was the worst performing stock for the week, falling -9.80 percent.
- SeaWorld shares fell after the company cut its dividend. The beleaguered theme park company said in a press release on Monday that it is lowering its dividend payout to $0.10 per share from $0.21 per share. Its board announced that it will no longer issue a dividend after the payment this quarter. Instead, it would be “opportunistically repurchasing” shares in the open market.
Opportunities
- GoPro unveiled three new action cameras and a drone. The Karma drone, retailing at $799, features a removable three-axis gimbal to stabilize footage captured by a GoPro on the drone itself, in your hands, or when a GoPro camera is mounted on your equipment.
- Pharma giant Allergan is buying Tobira Therapeutics. Allergan is paying an upfront price of $28.35 per share in cash, and up to $49.84 per share in so-called Contingent Value Rights (CVRs) if two drugs under development make it to market. Used together, the drugs under development – Cenicriviroc and Evogliptin – could help to treat NASH disease, a buildup of fat in the liver that can lead to liver failure.
- FedEx beat and raised its outlook this week. The courier giant earned $2.90 a share on revenue of $14.7 billion and said it saw full-year earnings per share in a range of $10.85 to $11.35, a bit light of analysts’ estimates.
Threats
- Deutsche Bank is the riskiest bank in the world, at least according to the latest data from the Federal Deposit Insurance Corporation.
- Carl Icahn dumped a bunch of his Chesapeake Energy shares. An SEC filing shows Carl Icahn owned a 4.55 percent stake in the energy explorer as of Monday, down from 9.40 percent on August 4, Reuters reports.
- UnitedHealth announced it will stop covering some brand-name drugs. The largest U.S. health insurer says it will stop coverage of Lantus, the main insulin drug sold by Sanofi SA, and Amgen’s white-blood-cell-boosting drug Neupogen, Reuters reports.
September 20, 2016Welcoming the New Addition to the S&P 500: Real Estate |
September 19, 2016The War on Cash Is Still Good for Gold |
September 13, 20165 Reasons Why Active Management Works |
The Economy and Bond Market
Strengths

- The National Association of Homebuilders’ housing market index, which measures sentiment, rose to an 11-month high of 65 in September. All three components – current sales, sales expectations and traffic of prospective buyers –improved. NAHB members were encouraged by rising household incomes and a steady job market.
- The number of Americans filing for unemployment benefits unexpectedly fell last week to a two-month low, pointing to labor market strength. Initial claims for state unemployment benefits declined 8,000 to a seasonally adjusted 252,000 for the week ended September 17.
- Evercore ISI retailer’s company surveys came in much stronger this week at 50.5 versus 47.6 prior.
Weaknesses
- The Federal Reserve held steady this week, saying that the case for an increase to the Fed funds rate later this year has strengthened. Three FOMC members disagreed with the decision to hold rates. While job gains have been solid, the labor market has not exerted enough upward pressure on inflation, the Fed’s statement said.
- U.S. home resales unexpectedly fell in August, crimped by a shortage of inventory that is boosting home prices faster than the pace of wage growth. The National Association of Realtors said on Thursday that existing home sales declined 0.9 percent to an annual rate of 5.33 million units. Economists polled by Reuters had forecast sales rising 1.1 percent in August to a 5.45 million-unit pace. July’s sales pace was also revised lower to 5.38 million units from the previously reported 5.39 million units.
- The Conference Board’s Leading Economic Index for the United States declined 0.2 percent in August to 124.1.
Opportunities
- The U.S. labor force participation rate is depressed, even relative to where it should be given trends in demographics. It is possible that this represents an extra source of slack, and that continued monetary easing would entice workers back into the labor force.
- The final print for second-quarter GDP will be released next Thursday. If the survey of 1.3 percent growth holds, it would be a boost from the previous 1.1 percent estimate.
- JPMorgan sees additional near-term upside for the S&P 500 in its latest U.S. strategy note. The report says positive equity momentum is likely to be bolstered by a better third-quarter earnings season and highlighted support from low expectations and stabilizing U.S. dollar and oil prices over last year. The group sees better opportunity in growth stocks.
Threats
- According to BCA, if the dollar stays well behaved and the drag from import prices abates, then inflation might accelerate quickly alongside an improving labor market. However, as long as global growth divergences persist, any move toward tighter Fed policy is likely to send the dollar higher, dragging inflation even further below target. Thus, until the global recovery becomes more synchronized, the Fed’s ability to tighten policy will be limited by an appreciating dollar.
- The Federal Reserve is focusing too narrowly on its so-called dual mandate and damaging basic financial infrastructure by keeping interest rates low, former Dallas Federal Reserve President Richard Fisher said Monday. Fisher has long raised concerns about funds and businesses that have a hard time making a profit when interest rates are low, including insurance companies and pensions.
- After the Federal Reserve opted to leave interest rates unchanged Wednesday, Jim Grant told CNBC he believes the markets are beginning to lose confidence in central banks. “I think the central banks are busy chipping away at the unwarranted faith in their pretense,” the founder and editor of Grant’s Interest Rate Observer said.
Gold Market
This week spot gold closed at $1,337.41, up $27.16 per ounce, or 2.09 percent. Gold stocks, as measured by the NYSE Arca Gold Miners Index, ended the week higher by 4.71 percent. Junior miners underperformed seniors for the week, as the S&P/TSX Venture Index climbed just 1.46 percent. The U.S. Trade-Weighted Dollar Index finished lower by 0.66 percent.
| Date | Event | Survey | Actual | Prior |
|
Sep-20 |
U.S. Housing Starts |
1190k |
1142k |
1212k |
|
Sep-21 |
FOMC Rate Decision |
0.50% |
0.50% |
0.50% |
|
Sep-22 |
U.S. Initial Jobless Claims |
261k |
252k |
260k |
|
Sep-26 |
U.S. New Home Sales |
600k |
— |
654k |
|
Sep-27 |
Hong Kong Exports YoY |
-2.0% |
— |
-5.1% |
|
Sep-27 |
U.S. Consumer Confidence Index |
98.8 |
— |
101.1 |
|
Sep-28 |
U.S. Durable Goods Orders |
-1.4% |
— |
4.4% |
|
Sep-29 |
Germany CPI YoY |
0.6% |
— |
0.4% |
|
Sep-29 |
U.S. GDP Annualized QoQ |
1.3% |
— |
1.1% |
|
Sep-29 |
U.S. Initial Jobless Claims |
260k |
— |
252k |
|
Sep-29 |
Caixin China PMI Mfg |
50.1 |
— |
50.0 |
|
Sep-30 |
U.S. CPI YoY |
0.9% |
— |
0.8% |
Strengths
- The best performing precious metal for the week was silver, with a gold-inspired lift of 4.80 percent. It is typical for silver to have a higher beta to gold.
- Gold is headed for its biggest weekly advance since July, reports Bloomberg, following the Federal Reserve’s decision this week to leave interest rates unchanged. The 25-percent rally that gold bullion saw in the first half of the year has sputtered this quarter, partly on concern that the Fed could have raised rates as soon as this week. In a similar fashion, gold futures gained after the Bank of Japan changed its focus on Wednesday (as traders awaited the Fed decision), from expanding the money supply to controlling interest rates.
- According to the average estimate in a survey of 16 participants at the Denver Gold Forum this week, gold prices will reach $1,385.63 an ounce by year end, reports Bloomberg. This forecast is 4.1 percent higher than Wednesday’s closing futures prices. As seen in the chart below, investors poured $249 million into gold-backed ETFs over the last week, the article continues. This has helped keep holdings near a three-year high.

Weaknesses
- Although gold was the worst performing precious metal for the week, it was a welcome gain none-the-less in light of worries surrounding a possible rate hike this month. Saxo Bank’s head of commodity strategy Ole Hansen believes that gold is due for a correction. Hansen recognizes that gold gains have been elusive lately, but says that the “market has become stale” and prices have “struggled to move higher.” He sees the metal falling back to the $1,250 per ounce level, but says once the stale longs have been cleared out of the market, gold could rise to $1,375 per ounce.
- According to Bloomberg, a potential interest-rate hike in the U.S. this year is spurring lower gold price expectations in India. This has the potential to deter buying, as the dollar strengthens versus the rupee. Interesting enough, estimates from Bloomberg Intelligence show that India’s gold hoarding since 2000 exceeds 12,500 tons (the U.S. reserve holdings come in at 8,133.5 tons during this period and China’s at 10,500 tons).
- An employee with the Royal Canadian Mint was caught this week for allegedly smuggling around $180,000 worth of gold from the facility, hiding the metal in his bum. An alert bank teller discovered the alleged theft, reports Postmedia News, after the man took small circular chunks of gold on multiple occasions to Ottawa Gold Buyers – typically receiving checks in the $6,800 range for pucks that weighed around 210 grams.
Opportunities
- Several members of the U.S. Global team attended the Denver Gold Forum this week, where investor attendance was up 15 percent from last year, with a mood that was a bit more optimistic. According to a recap from BMO, there were several key themes at this year’s event: 1) Disciplined capital allocation and reductions in costs, 2) Muted M&A, with an emphasis on existing portfolios and development pipelines, and 3) Renewed focus on exploration, and targeting organic over incremental. In the prior week, the Precious Metals Summit, where many of the exploration and development companies presented their investment merits, had just come to a close. There were numerous mine tours scheduled around the events. We attended the Klondex Mines tour of their True North Mine which was acquired late last year on very reasonable terms.

- Diego Parilla from Old Mutual Global Investors sees gold entering a long-term bull market, reports Bloomberg, likely soaring to a record within five years as asset bubbles pop in everything from bonds to credit to equities. “As some of the excesses in other asset classes get unwound, gold will perform very strongly,” Parilla said. Similarly, Robert McEwen (one of the industry’s most unabashed bulls, says Bloomberg) believes gold prices could rise as much as 44 percent by year end, trading in a range of $1,700 to $1,900 an ounce. McEwen says gold is a store of value that has gone for millennia. “The big argument against gold used to be it costs you money to store it,” he said. “Right now, it’s costing you money to store you cash.”
- According to a recent UBS Evidence Lab consumer survey in India, results show that the country has a relatively stable appetite for gold. When asked about the potential for gold purchases in the coming months, results were more or less the same, to slightly higher, versus 2015, reports UBS. The research continues by stating that there is a good potential for physical offtake in India to improve over the next couple of months.
Threats
- Gold mines in South Africa have seen output drop for decades, reports Bloomberg. The country’s largest gold producer is turning to an overlooked (and potentially cheaper) source of supply: the dump. “It’s easy gold, but the processing volumes are enormous,” said Grant Stuart, VP of projects at Westonaria, South African-based Sibanye. According to Bloomberg, once Sibanye’s mines are depleted, the company faces huge cleanup costs at so-called tailing dams that contain toxic materials like uranium and sulfides, along with traces of the yellow metal. If the tailings can be reprocessed economically that might ease the burden.
- Goldman Sachs is calling for an end in capex cuts, according to a note released this week. “Our thesis on capex cuts is that the sector has approached a point where there are limited opportunities to continue cutting capex – essentially the sector has ‘hit bone’”, the report reads. “Although the capex trend is still likely to be down year-over-year from 2016 levels, as projects roll off, we do not expect to see further cuts in our existing capex profile.” Should the gold price continue to rise, miners will be hard pressed to contain their spending.
- Gran Colombia announced this week that it is monitoring the civil situation in Segovia and Remedios in the Department of Antioquia, Colombia, where the company’s Segovia Operations are located. A local mining collective (made up mainly of illegal miners) has convened a civil strike to exert pressure on negotiations it’s having with various levels of government and Gran Colombia. The discussions are related to the Colombian government’s national program to formalize illegal mining in the country, at issue is Decree 1421 from the Ministry of Mining and Energy (which became effective on September 1). Earlier in the quarter, the government put an end to illegal mining on Continental Gold’s property.

Energy and Natural Resources Market
Strengths
- Gold is set to benefit from a replay of 2015. Macquarie Research suggests there are numerous parallels between this September’s FOMC rate decision and last year’s. With the Fed all but telegraphing a 25 basis point hike in December, we may see gold trade range bound for the next 90 days. However, Macquarie suggests this weakness could be a buying opportunity, as gold may rally once the FOMC hikes rates in December.

- The best performing sector for the week was the FTSE 350 Mining Index. The index of major diversified miners rose 10.6 percent for the week as strong August macro data from China lifted metals prices
- Anglo American PLC, a major South African diversified miner, was the best performing stock in the broader natural resource space for the week. The London-based company gained 15.8 percent for the week as investors regained optimism in China, propelling metals prices higher.
Weaknesses
- Oil prices tumbled on Friday, erasing half of the week’s gains as Saudi Arabia dismissed the prospects for an output agreement at next week’s informal OPEC meeting. Oil has gained ground since August on speculation that OPEC and Russia would agree to cap output when they meet on September 28. However, investors are now becoming nervous that no agreement will be reached.
- The worst performing sector for the week was the S&P 500 Oil & Gas Refining & Marketing Index. The index dropped 0.8 percent for the week as capacity increased with the restart of the Colonial Pipeline this week after earlier delays.
- The worst performing stock for the week in the broader natural resource space was CF Industries Holdings Inc. The fertilizer producer dropped 5.8 percent as analysts expect the cash crunch to deepen as crop prices continue to drop. The profitability of fertilizer companies is directly tied to higher crop prices that allow farmers to purchase more of their products.
Opportunities
- China house prices rose sharply in August, reports VTB Capital. Official data shows house prices in China’s 70 largest cities rose 9.2 percent compared to August last year, the fastest pace since January 2014. On a monthly basis, prices surged 1.5 percent, the strongest increase for more than three-and-a-half years, suggesting the PBOC has maintained its expansionary fiscal and monetary policies.
- Copper demand is improving in China according to Macquarie Research. End-user copper demand picked up in August, driven by sequential order growth in the construction and transportation sectors. A survey of copper fabricators suggests they are planning to raise production for the traditional golden season, which should help to improve the copper market balance in China.
- Rio Tinto CEO is “cautiously optimistic in relation to China.” Rio, the world’s second largest mining company, believes this is an inflection point that will result in improved market conditions in China. Rio bases its views on improved macro August data for China as well as more positive meetings with government officials in the country.
Threats
- China is set to curb spending on renewable energy after a record boom. A Bloomberg report suggests China’s spending on renewable energy will decline 11 percent next year as electricity demand stagnates along with slower GDP growth. China provides about a third of the global investment in renewable energy.
- Steel prices may remain under pressure as weaker demand leads to inventory builds. In spite of a recovering China construction sector in August, UBS reports that domestic inventories are up due to weak demand and rising production. In addition, Chinese steel exports have declined as a result of stronger competition from Asian peers, worsening the overall supply-demand dynamics.
- Iron ore indicators continue to deteriorate. As Goldman Sachs reports, restocking is back to 2015 levels, driving iron ore port inventories to this year’s highs. In addition, there are 50 million tons of capacity coming online in the next 6-9 months.
China Region
Strengths
- Taiwan’s Weighted Index soared almost 4.3 percent and reached new 52-week highs this week as Taiwan reopened following last week’s scheduled mid-Autumn holiday closures and on the back of positive iPhone reports and continued accommodative central banking policies.

- The Philippines’ Stock Exchange Index returned 2.29 percent for the week, while South Korea’s KOSPI Index returned 1.9 percent for the week, and although both indices were handily shown up by Taiwan in that time, both put in strong performances.
- The South Korean won gained about 2 percent against the U.S. dollar for the week, making the won the strongest gainer in the region in that timeframe.
Weaknesses
- The Philippine peso, on the other hand, actually reached new lows for the week against the U.S. dollar, falling about 40 basis points to as much as 48.13. The Philippine central bank left key interest rates unchanged this week.
- The Hang Seng Consumer Services sector fell nearly 2 percent for the week.
- Indonesia’s Jakarta Composite Index underperformed its regional peers this week, falling almost 40 basis points in that timeframe, even as the Bank of Indonesia cut rates by 25 basis points and suggested that further cuts could come this year if necessary.
Opportunities
- Next week investors receive useful data in the form of September Caixin China Manufacturing PMI (expectations are for a 50.1 print) as well as the official government readings for both Manufacturing PMI (expectations are for a 50.5 print) and Non-Manufacturing PMI.
- Bloomberg news reports that the Finance Ministry of Indonesia has already received some 48.5 trillion rupiah via its Tax Amnesty Program.
Threats
- The Philippines Environment Secretary Gina Lopez continues to talk tough against miners operating in the country, suggesting that audits and recommendations by the government will require full compliance or risk further shutdowns and closures.
- Chinese mainland visitors to Macau fell 5.5 percent in August even as gaming revenue rose slightly.
- Both major party U.S. presidential candidates have suggested they will oppose the Trans-Pacific Partnership (TPP) trade pact negotiated between the U.S. and 11 other nations. President Obama seeks to persuade Congress to pass the TPP before he leaves office, but investors may look for more clarity from the candidates to succeed Mr. Obama as the first U.S. presidential debate kicks off on Monday evening.
Emerging Europe
Strengths
- Turkey was the best performing country this week, gaining 5 percent. The Borsa Istanbul stock exchange rallied following the Federal Reserve’s decision not to hike rates, along with comments from Moody’s that the coup has not seriously affected anything. The Central Bank of Turkey cut its overnight lending rate by 25 basis points, from 8.5 to 8.25 percent.
- The Russian ruble was the best performing currency this week, gaining 1.5 percent against the U.S. dollar. Russia is placing another Eurobond sale, worth $1.25 billion. Notes are due by 2026 and are yielding 3.99 percent. The new offering exhausts Russia’s limit of $3 billion for overseas sales this year.
- The real estate sector was the best performing sector among Eastern European markets this week. The MSCI updated its Global Industry Classification Standards and has added the real estate sector from under the financial sector, bringing the number of GICS sectors to 11.
Weaknesses
- Hungary was the worst relative performing market this week, gaining 10 basis points. The National Bank of Hungary kept the three-month deposit rate at 0.9 percent as central bankers focus on unconventional easing to avoid further rate cuts. The monetary authority is accepting deposits in its benchmark facility once a month starting in August, instead of weekly, and will begin capping deposits in October.
- The Ukrainian hryvnia was the worst performing currency this week, losing 60 basis points against the U.S. dollar. Economic data is improving. Gross domestic product, retail sales and industrial production were reported above estimates; however, the country needs to continue pushing forward with its reform program to boost investors’ confidence.
- The utilities service sector was the worst performing sector among Eastern European markets this week.
Opportunities
- The government of the Czech Republic is aiming to sell as much as 80 billion koruna ($3.3 billion) from October to December. The borrowing conditions for the Czech Republic have never been better, as investors are buying short-term bonds with negative yields, speculating gains from the koruna after the country’s central bank removes the cap on the currency next year.
- The Federal Reserve did not hike rates during its latest meeting held this week, creating positive sentiment in emerging markets. The decision was in line with the majority of economists, who set the odds of a September rate hike at around 18 percent due to a sluggish economy, with inflation far below the bank’s target of 2 percent. The Fed has two more meetings this year, on November 1 and December 13. It is widely believed that Fed chair Janet Yellen is unlikely to raise rates just days before the upcoming Presidential election. The U.S. central bank last raised interest rates in December 2015, from 25 basis points to 50 basis points.
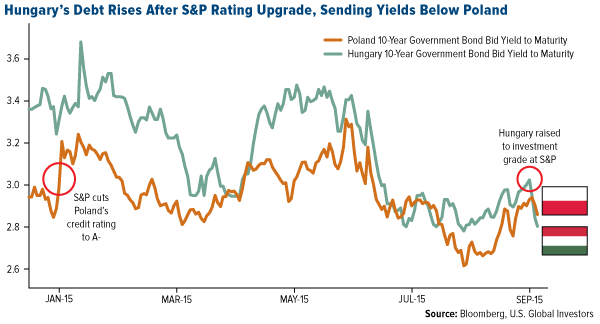
- S&P credit rating agency upgraded Hungary to investment grade, sending yields on Hungary’s 10-year local currency bonds below Poland. Hungary is now ranked above junk by two agencies, making it possible for funds that can only buy investment-grade debt to start accumulating Hungary’s bonds. Poland’s debt is rated at A-, three steps higher than Hungary, but was downgraded in January by S&P.
Threats
- According to Kommersant, the Russian government is considering extending the higher mineral extraction tax (MET) rate for oil into 2017, and wants to introduce an additional tax burden on gas in the amount of RUB179 billion. Higher taxes could be applied to all Russian producers, not just Gazprom, as previously discussed. The tax proposal is in the early stages of discussion and may provide some volatility among listed Russian oil and gas companies.
- S&P raised Russia’s outlook from negative to stable, but an upgrade to an investment grade rating is unlikely in the foreseeable future, according to Christian Esters, senior director for sovereign ratings. The challenges facing Russia’s economy range from its competitiveness to its dependence on the export of commodities. Access to the international markets is very limited due to the sanctions imposed on the country over the conflict in Ukraine, and S&P assumes sanctions on Russia will stay in place for the next three years.
- The European Commission opened an investigation on a new Polish progressive tax imposed September 1 on the retail sector. The Commission says the tax is discriminatory and ordered its suspension. UBS analysts predict a flat tax rate will be proposed by the Polish government but with the same sort of tax-free threshold in order to protect the smaller players. The retail tax was imposed to help the budget gap.

Leaders and Laggards
| Index | Close | Weekly Change($) |
Weekly Change(%) |
|---|---|---|---|
| DJIA | 18,261.45 | +137.65 | +0.76% |
| S&P 500 | 2,164.69 | +25.53 | +1.19% |
| S&P Energy | 497.27 | +0.48 | +0.10% |
| S&P Basic Materials | 297.33 | +3.42 | +1.16% |
| Nasdaq | 5,305.75 | +61.18 | +1.17% |
| Russell 2000 | 1,254.62 | +29.84 | +2.44% |
| Hang Seng Composite Index | 3,198.55 | +48.38 | +1.54% |
| Korean KOSPI Index | 2,054.07 | +54.71 | +2.74% |
| S&P/TSX Global Gold Index | 244.15 | +9.80 | +4.18% |
| XAU | 95.76 | +4.26 | +4.66% |
| Gold Futures | 1,341.50 | +31.30 | +2.39% |
| Oil Futures | 44.70 | +1.67 | +3.88% |
| Natural Gas Futures | 2.97 | +0.02 | +0.71% |
| 10-Yr Treasury Bond | 1.62 | -0.07 | -4.37% |
| Index | Close | Monthly Change($) |
Monthly Change(%) |
|---|---|---|---|
| DJIA | 18,261.45 | -220.03 | -1.19% |
| S&P 500 | 2,164.69 | -10.75 | -0.49% |
| S&P Energy | 497.27 | -17.19 | -3.34% |
| S&P Basic Materials | 297.33 | -8.03 | -2.63% |
| Nasdaq | 5,305.75 | +88.05 | +1.69% |
| Russell 2000 | 1,254.62 | +17.37 | +1.40% |
| Hang Seng Composite Index | 3,198.55 | +119.18 | +3.87% |
| Korean KOSPI Index | 2,054.07 | +10.31 | +0.50% |
| S&P/TSX Global Gold Index | 244.15 | +6.06 | +2.55% |
| XAU | 95.76 | +0.42 | +0.44% |
| Gold Futures | 1,341.50 | +11.80 | +0.89% |
| Oil Futures | 44.70 | -2.07 | -4.43% |
| Natural Gas Futures | 2.97 | +0.17 | +6.19% |
| 10-Yr Treasury Bond | 1.62 | +0.06 | +3.65% |
| Index | Close | Quarterly Change($) |
Quarterly Change(%) |
|---|---|---|---|
| DJIA | 18,261.45 | +860.70 | +4.95% |
| S&P 500 | 2,164.69 | +127.28 | +6.25% |
| S&P Energy | 497.27 | -0.45 | -0.09% |
| S&P Basic Materials | 297.33 | +8.18 | +2.83% |
| Nasdaq | 5,305.75 | +597.77 | +12.70% |
| Russell 2000 | 1,254.62 | +127.09 | +11.27% |
| Hang Seng Composite Index | 3,198.55 | +450.52 | +16.39% |
| Korean KOSPI Index | 2,054.07 | +128.83 | +6.69% |
| S&P/TSX Global Gold Index | 244.15 | +0.52 | +0.21% |
| XAU | 95.76 | +2.06 | +2.20% |
| Gold Futures | 1,341.50 | +12.70 | +0.96% |
| Oil Futures | 44.70 | -2.94 | -6.17% |
| Natural Gas Futures | 2.97 | +0.31 | +11.53% |
| 10-Yr Treasury Bond | 1.62 | +0.06 | +3.72% |
U.S. Global Investors, Inc. is an investment adviser registered with the Securities and Exchange Commission (“SEC”). This does not mean that we are sponsored, recommended, or approved by the SEC, or that our abilities or qualifications in any respect have been passed upon by the SEC or any officer of the SEC.
This commentary should not be considered a solicitation or offering of any investment product.
Certain materials in this commentary may contain dated information. The information provided was current at the time of publication.
Some links above may be directed to third-party websites. U.S. Global Investors does not endorse all information supplied by these websites and is not responsible for their content.
All opinions expressed and data provided are subject to change without notice. Some of these opinions may not be appropriate to every investHoldings may change daily.
Holdings may change daily. Holdings are reported as of the most recent quarter-end. The following securities mentioned in the article were held by one or more accounts managed by U.S. Global Investors as of 06/31/2016:
Doray Minerals
Evolution Mining
Franco-Nevada
Gazprom PJSC
Gran Colombia Gold Corp
Klondex Mines Ltd.
Northern Star Resources
Royal Gold
Saracen Minerals
Sibanye Gold Ltd.
Silver Wheaton
St. Barbara
The Dow Jones Industrial Average is a price-weighted average of 30 blue chip stocks that are generally leaders in their industry.
The S&P 500 Stock Index is a widely recognized capitalization-weighted index of 500 common stock prices in U.S. companies.
The Nasdaq Composite Index is a capitalization-weighted index of all Nasdaq National Market and SmallCap stocks.
The Russell 2000 Index® is a U.S. equity index measuring the performance of the 2,000 smallest companies in the Russell 3000®, a widely recognized small-cap index.
The Hang Seng Composite Index is a market capitalization-weighted index that comprises the top 200 companies listed on Stock Exchange of Hong Kong, based on average market cap for the 12 months.
The Taiwan Stock Exchange Index is a capitalization-weighted index of all listed common shares traded on the Taiwan Stock Exchange.
The Korea Stock Price Index is a capitalization-weighted index of all common shares and preferred shares on the Korean Stock Exchanges.
The Philadelphia Stock Exchange Gold and Silver Index (XAU) is a capitalization-weighted index that includes the leading companies involved in the mining of gold and silver.
The U.S. Trade Weighted Dollar Index provides a general indication of the international value of the U.S. dollar.
The S&P/TSX Canadian Gold Capped Sector Index is a modified capitalization-weighted index, whose equity weights are capped 25 percent and index constituents are derived from a subset stock pool of S&P/TSX Composite Index stocks.
The S&P 500 Energy Index is a capitalization-weighted index that tracks the companies in the energy sector as a subset of the S&P 500.
The S&P 500 Materials Index is a capitalization-weighted index that tracks the companies in the material sector as a subset of the S&P 500.
The S&P 500 Financials Index is a capitalization-weighted index. The index was developed with a base level of 10 for the 1941-43 base period.
The S&P 500 Industrials Index is a Materials Index is a capitalization-weighted index that tracks the companies in the industrial sector as a subset of the S&P 500.
The S&P 500 Consumer Discretionary Index is a capitalization-weighted index that tracks the companies in the consumer discretionary sector as a subset of the S&P 500.
The S&P 500 Information Technology Index is a capitalization-weighted index that tracks the companies in the information technology sector as a subset of the S&P 500.
The S&P 500 Consumer Staples Index is a Materials Index is a capitalization-weighted index that tracks the companies in the consumer staples sector as a subset of the S&P 500.
The S&P 500 Utilities Index is a capitalization-weighted index that tracks the companies in the utilities sector as a subset of the S&P 500.
The S&P 500 Healthcare Index is a capitalization-weighted index that tracks the companies in the healthcare sector as a subset of the S&P 500.
The S&P 500 Telecom Index is a Materials Index is a capitalization-weighted index that tracks the companies in the telecom sector as a subset of the S&P 500.
The NYSE Arca Gold Miners Index is a modified market capitalization weighted index comprised of publicly traded companies involved primarily in the mining for gold and silver.
The Consumer Price Index (CPI) is one of the most widely recognized price measures for tracking the price of a market basket of goods and services purchased by individuals. The weights of components are based on consumer spending patterns.
The Purchasing Manager’s Index is an indicator of the economic health of the manufacturing sector. The PMI index is based on five major indicators: new orders, inventory levels, production, supplier deliveries and the employment environment.
The S&P/TSX Venture Composite Index is a broad market indicator for the Canadian venture capital market. The index is market capitalization weighted and, at its inception, included 531 companies. A quarterly revision process is used to remove companies that comprise less than 0.05% of the weight of the index, and add companies whose weight, when included, will be greater than 0.05% of the index.
Standard deviation is a measure of the dispersion of a set of data from its mean. The more spread apart the data, the higher the deviation. Standard deviation is also known as historical volatility. There is no guarantee that the issuers of any securities will declare dividends in the future or that, if declared, will remain at current levels or increase over time.
Diversification does not protect an investor from market risks and does not assure a profit. Cash Flow Return on Invested Capital is defined as consolidated cash flow from operating activities minus capital expenditures, the difference of which is divided by the difference between total assets and non-interest bearing current liabilities.
The Bloomberg Commodity Index is made up of 22 exchange-traded futures on physical commodities. The index represents 20 commodities, which are weighted to account for economic significance and market liquidity.
National Association of Homebuilders’ Housing Market Index is based on a monthly survey of NAHB members designed to take the pulse of the single-family housing market The Conference Board index of leading economic indicators is an index published monthly by the Conference Board used to predict the direction of the economy’s movements in the months to come. The index is made up of 10 economic components, whose changes tend to precede changes in the overall economy.
S&P Oil & Gas Refining and Marketing Index tracks the market performance of downstream oil and gas companies.
The FTSE 350 Mining Index is a capitalization-weighted index of all stocks designed to measure the performance of the mining sector of the FTSE 350 Index. The index was developed with a base value of 1000 as of December 31, 1985.
Beta is a measure of the volatility, or systematic risk, of a security or a portfolio in comparison to the market as a whole.
M2 Money Supply is a broad measure of money supply that includes M1 in addition to all time-related deposits, savings deposits, and non-institutional money-market funds.
The Taiwan Weighted Index contains all Taiwan Stock Exchange issues (560 common stocks). It is a market-capitalization weighted index.
The Philippine Stock Exchange PSEi Index is composed of stocks representative of the industrial, properties, services, holding firms, financial and mining & oil sectors of the Philippines Stock Exchange.
The Jakarta Stock Price Index is a modified capitalization-weighted index of all stocks listed on the regular board of the Indonesia Stock Exchange.
This email was sent to preciousmetalswarrants@yahoo.com. Click here to update your email preferences.
U.S. Global Investors, Inc. 7900 Callaghan Road, San Antonio, TX 78229
1-800-USFUNDS www.usfunds.com