The Outcome
**the examples and commentary given are for informational purposes only and as with any investment decisions you are encouraged to do your own due diligence and consult your licensed investment advisor**
Return to the first part of this article series if any of the terminology or discussion in parts of this series needs clarification.
Continuing where we left off, we have now identified our targets based on the methodology that has been discussed. The next stage is to spend some money and roll the dice with a statistical advantage in our corner.
Revisiting the previous list of targets we have been outlining and including with our entry prices the final exit prices let’s see how they performed individually and as the proposed “basket”.
WARRANT |
COMPANY NAME |
ENTRY PRICE |
EXIT PRICE |
% CHANGE |
| NFINW | Netfin Acquisition Corp | $1.08 | 1.47 | 36.11% |
| TOTAW | Tottenham Acquisition I Limited | $0.19 | 0.42 | 121.05% |
| SAQNW | Software Acquisition Group Inc | $0.97 | 1.15 | 18.56% |
| KCAC.WS | Kensington Capital Acquisition | $0.8956 | 6.3 | 603.44% |
| CFFAW | CF Finance Acquisition Corp | $0.95 | 1.01 | 6.32% |
| FPAC.WS | Far Point Acquisition Corporation | $0.93 | 0.78 | -16.13% |
| SOAC.WS | Sustainable Opportunities Acquisition Corp. | $0.8999 | 1.31 | 45.57% |
| FTACW | Federal Street Acquisition Corp III | $1.45 | 1.61 | 11.03% |
| NBACW | Newborn Acquisition Corp | $0.138899 | 0.1459 | 5.04% |
| ALACW | Alberton Acquisition Corp | $0.09 | 0.2 | 122.22% |
How big are the returns? Was it worth the time? How much was the comparable investment in other securities e.g. the common shares? We have just scratched the surface of these questions and now are going to look at how this cycle performed and when if any exits presented themselves prior to reaching our end date. At first glance the obvious outlier is FPAC.WS as it was the only decliner in the basket but we will get to that momentarily, the others show a generally positive trend with not 1 but multiple outliers and as expected the remaining were positive yet relatively unchanged (relative is in the eye of the beholder here.)
How did our basket perform with uncertain markets and unexpected events?
The story here is best told after a quick display of the charts, and arguably there are so many charting platforms to deploy here, however, if you have ever done the research on older warrants then you understand that most of them do not exist. That being said, Big Charts provides a good way to show two things at once on this particular basket of securities because, after all, we are not just curious about our investment but rather how much more leverage did it allow for than a comparable trade in the underlying common. The key word is leverage and you should never forget that this is about leveraging your capital. The charts shown in sequence below will mirror our list and as you will see in the legend to the upper left, there is a darker line for the warrant and a lighter one for the common for the same time period. Spend a few minutes looking over the next sequence of charts and look at where the action was. Do you see the exit points at any time prior to our date that would have been a trigger for you personally to exit and capture larger than the basket did for the full length? Were there non-performers you would have left off the list from the beginning? Each chart tells a story, where do you see patterns? One last detail to include here that has been included as an almost anecdotal detail to insure this has to be read is one of the more important details as well. What were the dates? This experiment ran from Aug. 25, 2020 to September 03, 2020 and was originally pegged for 7 days but excluded the weekend in that representation which could be confusing so the example is presented as a 10 day target.
NFINW compared to NFIN
Of particular interest in this chart is the non-existent movement with the common shares. 36.11% change per our basket

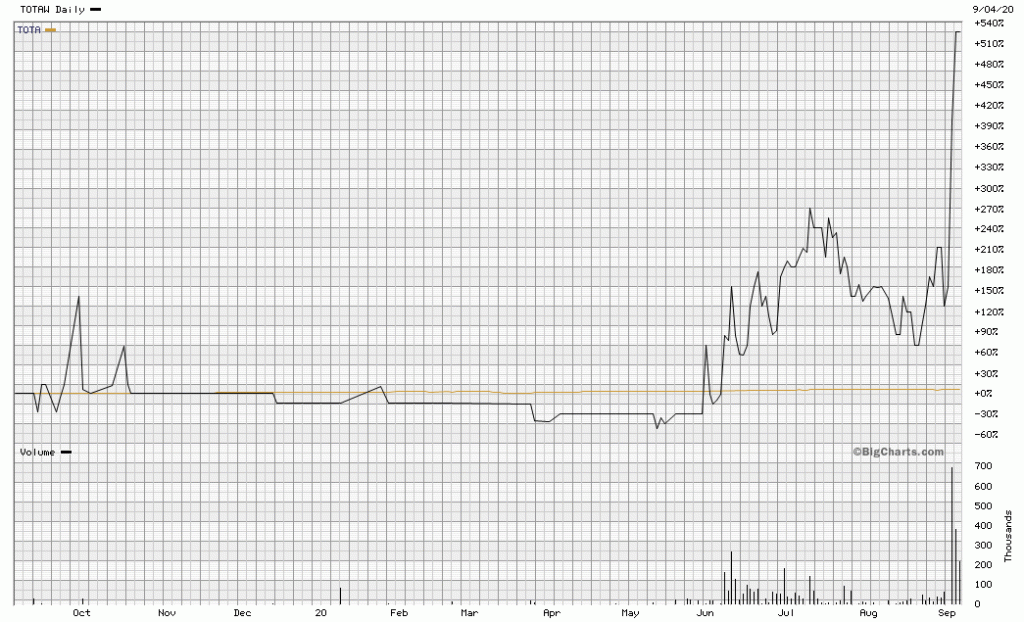
TOTAW compared to TOTA
Of particular interest in this chart is the non-existent movement with the common shares. The explosive doubling of the security should also not be ignored. 121.05% change per our basket

SAQNW compared to SAQN
While there is a faint resemblance of movement in the common shares, it should be noted that in each situation the warrant outperformed drastically in comparison to the common. 18.56% change per our basket
KCAC.WS compared to KCAC
It should come as no surprise from looking at this chart that Kensington Capital announced a merger towards the end of our target range. There is always a degree of ambiguity with when to exit but in this case the movement was inarguably following an upward trend and we had called an exit at 7 bucks as being “better than ideal” on the Fri open, as part of this example it is pegged at the Thurs price even though it is lower. Remember that the entry date on this warrant was August 25, 2020. 603.44% change per our basket

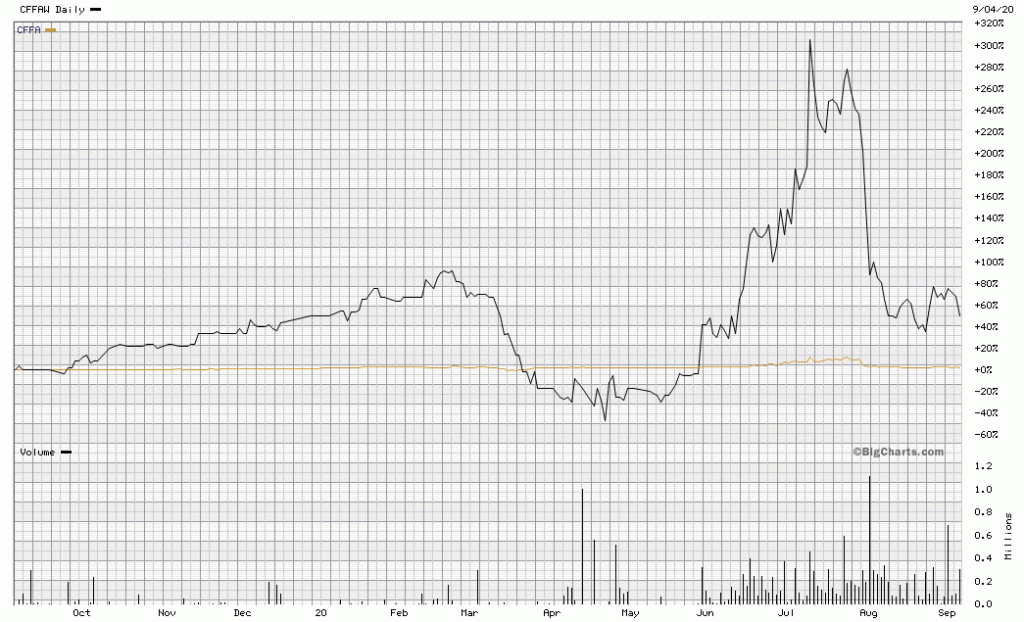
CFFAW compared to CFFA
Worth noting the trend of the common shares in this chart and due to the lackluster movement does it weigh heavier for the next basket? Do you keep this based on its original metrics or abandon in pursuit of the next full basket of 10?6.32% change per our basket

FPACW compared to FPAC
Worth noting the only losing pick of the week, this chart had to be sourced elsewhere as the warrant was not available on this charting service and while it did present an earlier exit point with actual gains, the odds of successfully catching that particular moment as an exit rather than believing it was possibly breaking out are a hard determination. The announcement of a merger had come just days before and would have normally removed this warrant from the targets but a combination of other factors allowed it to remain in our internal calculations. While it did decrease, for the purposes of this example, having the losers comprise a basket was expected from the onset as a diversification strategy with no clear expectation on which of the basket would perform/overperform or underperform -16.13% change per our basket

Notably one of the only examples where the common shares showed any activity resembling the warrant as seen below
SOAC.WS compared to SOAC
While there is a faint resemblance of movement in the common shares, it should be noted that in each situation the warrant outperformed drastically in comparison to the common. 45.57% change per our basket

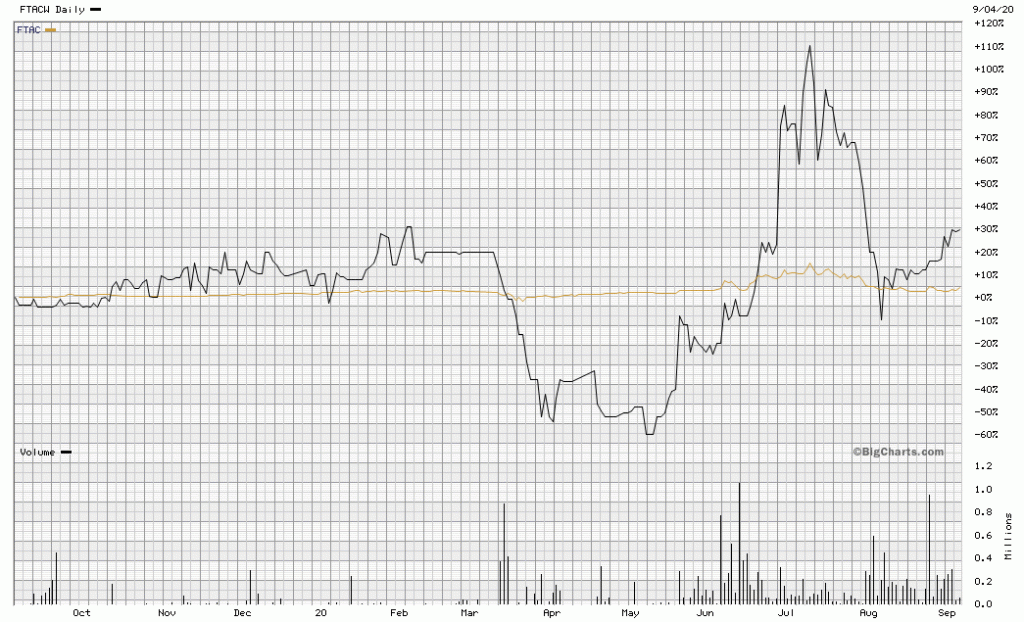
FTACW compared to FTAC
This is a relatively straightforward upward trend and resulted in an 11.03% change per our basket
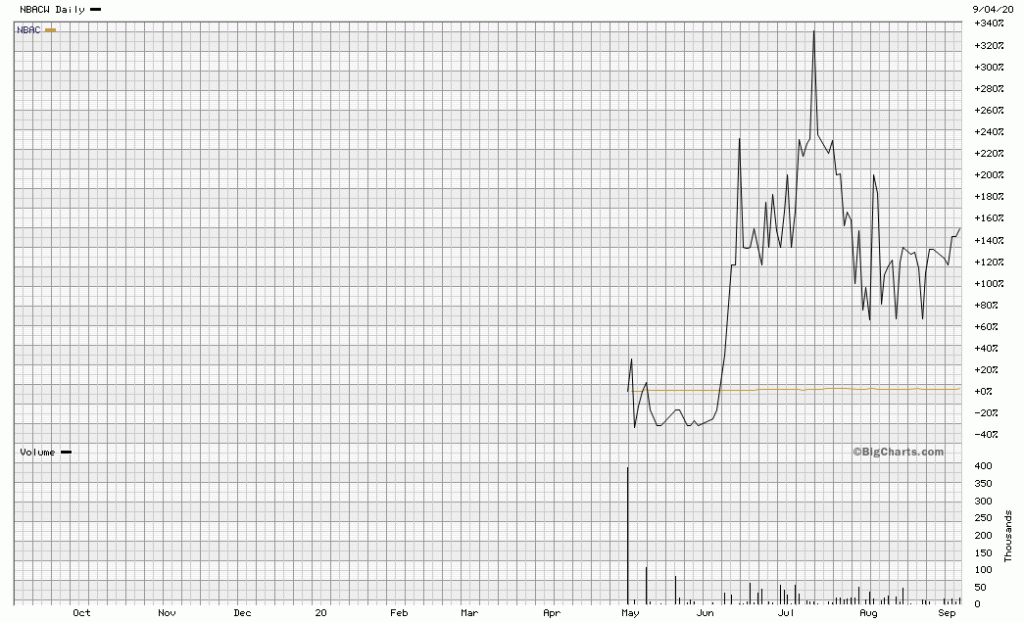
NBACW compared to NBAC
Of particular interest in this chart is the non-existent movement with the common shares.This stock had minimal performance and could be reserved for a second potential week due to its price. 5.04% change per our basket

ALACW compared to ALAC
Of particular interest in this chart is the non-existent movement with the common shares. The explosive doubling of the stock warrants should also not be ignored. 122.22% change per our basket.

After reviewing the charts and associated commentary was the disparity in the warrant and underlying common stock glaringly obvious? In all but the parabolic situations the relationship to the common is absent in these cycles. Make of it what you will, but the earlier correlation of the exercise price that was discussed in part one of this series is important here. The common share in this and many scenarios involving warrants or rather the trade in warrants is limited to the intrinsic value unless you were going to exercise those warrants. This is outlined in many articles we have written as being opposed to our investment ideologies. Trading a warrant is like trading a stock. Exercising it would have to involve scenarios not depicted in this article series. The relationship of the common and the warrant as part of this basket trade is tethered to the extent you see in the charts. Yes, there are times where things relating to the common will cause activity, but most of the time, that activity is realized through the warrant as evidenced above.
The conclusions of this and results of the trades are featured alongside our warrant calculator in the last part of this series available on Labor Day.
Quick Links to the rest of this article series as they are posted are available below:
- Trading your way to quick gains with a basket of warrants. (part 1 of 5)
- Trading your way to quick gains with a basket of warrants. (part 2 of 5)
- Trading your way to quick gains with a basket of warrants. (part 3 of 5)
- Trading your way to quick gains with a basket of warrants. (part 4 of 5)
- Trading your way to quick gains with a basket of warrants. (part 5 of 5)
What’s the catch Jeff?
It would be pretty great if you decided to SUBSCRIBE to our database so that you can begin finding warrants that fit your investment needs. More hours have been spent curating and updating the data than any other service available and we seek to give the largest collection of these securities for helping you make sound decisions based on leveraging your cash into bigger returns. That is, after all, the beauty of the warrant as an investment vehicle… Leverage.
